Chance Conversion – MH
Conversion rate has statistically been proven to be one of the best indicators for predicting a team’s success (Souza et al., 2019). All the more astonishing, then, that the underlying influencing factors are still largely unknown to most, leaving chance conversion for many as something of a black box. This analysis aims to improve the effectiveness and efficiency of goalscoring situations.
Chance conversion is most often associated with mental aspects. Accordingly, after defeats it is sometimes used as an excuse, partly due to a lack of more convincing alternative explanations. After all, the coach is said to have little or no influence on the psychological state of his players. Instead, the players are expected to learn how to better handle the pressure of a goalscoring opportunity, and in doing so become more efficient in front of goal.
Contents
-
What is Chance Conversion?
-
Effectiveness of Chances – Creating High-Quality Goalscoring Opportunities
2.1. Evaluating Chances Using Expected Goals (xG) Models
2.2. Additional Factors Influencing Scoring Probability at the Moment of the Shot
2.3. Creation of Chances / Evaluating the Action Sequence Instead of the Shot Itself
2.3.1. Creation of Chances from Possession Phases and Transition Situations
2.3.2. Effective Assist Zones in the Final Third
2.4. Insights from Possession Value (PV) Models for Evaluating Chances from Possession Phases
2.5. The Definition of Chances
2.6. Athletic Abilities to Increase Effectiveness
2.7. Effective Playing Styles -
Efficiency of Chances – Making Optimal Use of Existing Opportunities
3.1. Increasing Efficiency Sustainably
3.1.1. Improving Efficiency – Is It Possible?
3.1.2. How Can Efficiency Be Improved?
3.1.3. More Efficient Finishing: Evaluating Shots with Post-Shot Expected Goals (PSxG) Models
3.2. Preventing Short-Term Fluctuations in Efficiency
3.2.1. Influence of Team Cohesion and Rotations on Efficiency Fluctuations
3.2.2. Counterintuitive chance conversion of National Teams
3.2.3. Influence of Quantity and Quality of Chances on Efficiency
3.3. Coping with Temporary Underperformance Despite Optimal Conditions -
Using Randomness
4.1. The Role of Randomness – An Examination
4.2. Randomness vs. Luck in Football
4.3. A Random but Not Luck-Based Playing Style -
Conclusion
1. What is Chance Conversion?
Chance conversion measures the ratio of goals scored to chances created. A higher rate indicates better conversion. Contrary to common assumptions, chance conversion cannot be improved simply by increasing the number of chances. A greater quantity of opportunities does not automatically lead to a better conversion rate. If a coach criticizes chance conversion, the primary aim should therefore not be the mere generation of additional chances.
This perspective can lead to results that may contradict intuitive football logic. Teams can in fact be more successful with a reduced number of chances, provided that this reduction is accompanied by an increase in quality (effectiveness) and/or efficiency. Although the number of chances generally increases the probability of scoring, when conversion rates are actually poor, the priority should be to work on conversion rates itself. In such cases, improving conversion raises the likelihood of scoring more than simply increasing the quantity of chances.
There are therefore two approaches to improving chance conversion:
- Increasing effectiveness, which indirectly improves the conversion rate
- Increasing efficiency, which directly improves the conversion rate
The difference between effectiveness and efficiency can fundamentally be explained as follows: effectiveness means doing the right things, while efficiency means doing things the right way. Effectiveness measures whether a goal is achieved at all, whereas efficiency evaluates how that goal is achieved. Where efficiency exists, a minimum level of effectiveness is always present, but not necessarily the other way around.
Applied to chance conversion in football, the terms can be used as follows: effectiveness refers to actually converting chances into goals (“We scored”); efficiency means scoring as many goals as possible from as few chances as possible (“We scored with one shot instead of ten”).
From this, several constellations arise. High effectiveness combined with low efficiency means many goals, but also many missed chances. The team scored often, but with high effort. High efficiency with low effectiveness means relatively many goals from very few chances, yet the overall number of goals remains low. The latter combination is particularly relevant when applied over a longer period of time.
2. Effectiveness of Chances – Creating High-Quality Goalscoring Opportunities
The premise of this section is that an improvement in effectiveness occurs through an increase in the quality of chances, thereby leading to better conversion, since higher-quality shooting situations are more likely to be converted into goals. In order to increase the quality of a goalscoring opportunity, it must first be established what constitutes a high-quality shooting situation. In this field, research and data analysis are already well advanced. The most prominent model for evaluating chances is without doubt Expected Goals (xG).
2.1 .Evaluating Chances Using Expected Goals (xG) Models
According to a data analysis of the UEFA Champions League by Gonzáles-Rodenas et al. (2019), around 75% of goals are scored from open play, and 25% from set pieces, of which approximately 10% come from penalties, 8% from free kicks, and 7% from corners. On the one hand, this highlights the importance of set pieces in chance conversion; on the other hand, penalties and free kicks in particular are often provoked by dangerous situations in open play.
Given that set pieces represent a special case in data analysis, since they are determined by different factors, this article focuses exclusively on those factors that influence chances created from open play. The more complex and modern xG models take into account the following factors of a chance arising from open play:
-
Distance and angle of the shooter to the goal
-
Position and status of the goalkeeper: line of sight, influence on distance & angle to the shooter
-
Type of shot / control at the moment of shooting: ball height, body part, foot used, …
-
Type of assist or preceding action (through ball, cross, throw-in, dribble, rebound, first touch [shot or control], …)
-
Influence of defenders: clarity of the shooting situation on goal, defensive pressure on the shooter
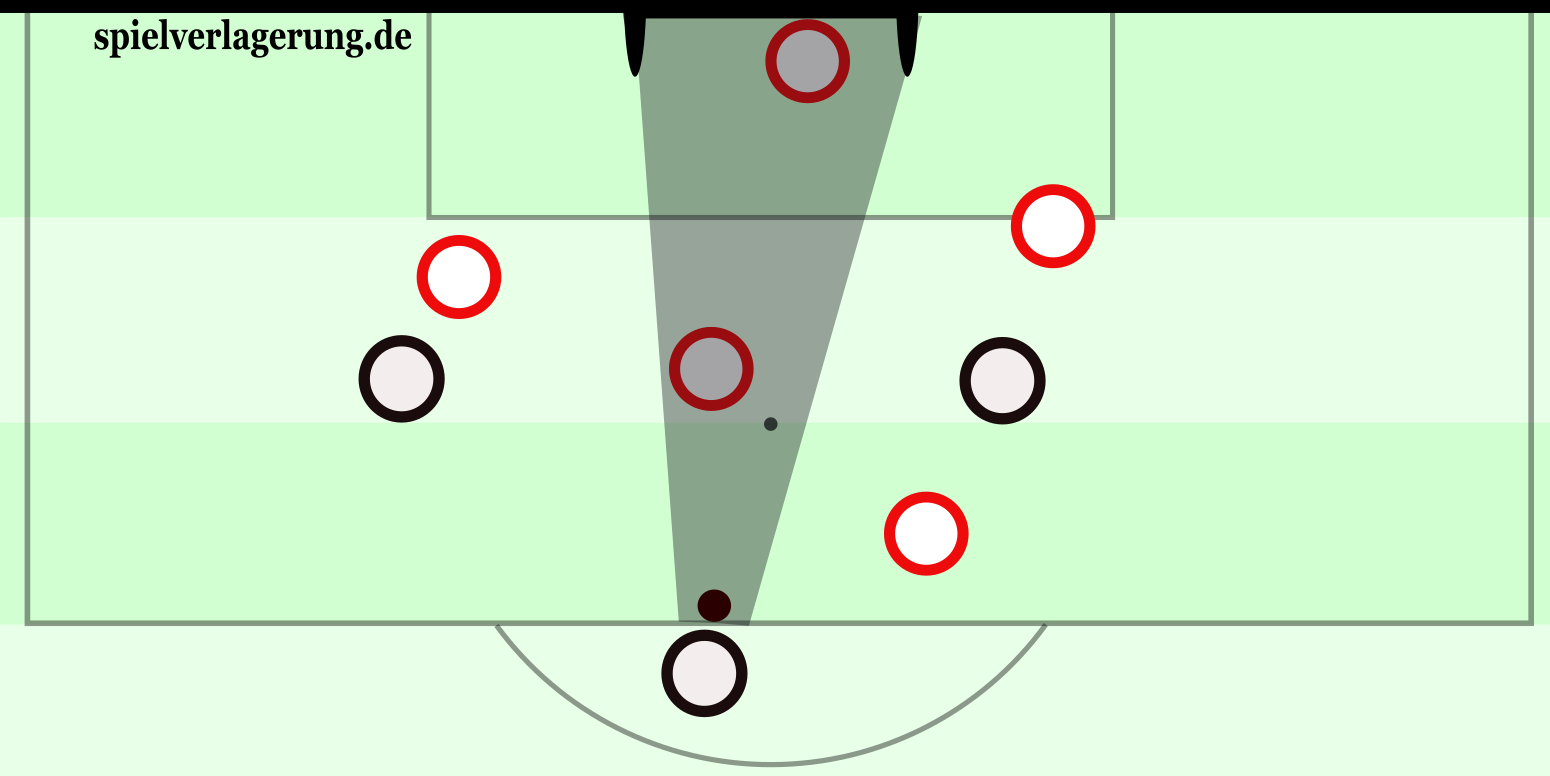
Shot clarity – here, one defender and the goalkeeper are in the potential shooting lane
Pressure on the shooter – here, an opponent is within tackling distance
xG models are based on established studies and data analyses that examine the influence of various factors on the probability of a successful shot on goal. In the course of my work, I conducted an extensive review of the existing literature in order to extract reliable data. Based on this evaluation, the following insights into the quality of goalscoring opportunities can be derived, among others:
Position: Shots from the central penalty area (60–120° angle, up to 20 m distance) are significantly more promising; according to Mead et al. (2023), the probability of scoring decreases linearly up to 20 meters, after which other factors dominate. This is likely partly due to the fact that, inside the box, the threat of a penalty changes defensive behavior. An Opta data analysis further showed that many players with high finishing quality do not necessarily stand out through above-average efficiency, but rather through frequent shots from good positions.
Type of assist: Crosses are generally more difficult to convert than through balls (defense-splitting diagonal passes) or shots following dribbles. Logically, the higher the level of ball control, the higher the probability of a successful finish.
Type of shot: From the same distance, shots with the foot are more likely to result in goals than headers. However, according to Deb & Dey (2019), headers are usually taken from closer range. The difficulty of converting crosses, though, suggests a primary focus on dribbles or low passes to increase ball control in the final third.
Pressure and clarity: According to Opta/Stats Perform data, chances under high pressure (defender within tackling distance) are converted in 8% of cases, while chances under low pressure (no influencing defensive movements) are converted in 15% of cases. This near doubling of the scoring probability highlights the significant influence of defensive pressure on the shooter. At the same time, 82% of low-clarity chances (more than two defenders between shooter and goal) are blocked or go off target. By contrast, high-clarity attempts (only one defender, including the goalkeeper, between shooter and goal) hit the target in 61% of cases.
These findings can be used by coaches to improve the quality of chances through training exercises, video analysis, coaching points, game principles, and other methods. For illustration: an analysis or training exercise derived from these findings to improve chance quality could focus on individual positioning, running directions, timing of runs, and the striker’s optimal speed relative to the ball and the opponent in recurring game situations. Ultimately, correct positioning before the shot has been shown to be one of the most important, if not the most important, factors in increasing the probability of scoring.
2.2. Additional Factors Influencing Scoring Probability at the Moment of the Shot
Studies have been able to identify additional factors that significantly influence the probability of scoring, yet are not incorporated into most Expected Goals models. In particular, factors that need to be considered within an action context are generally still overlooked.
For example, the speed of the player taking the shot is, according to Anzer & Bauer (2021), a factor correlated with scoring probability. In general, higher speed also increases the likelihood of scoring. On the one hand, this may relate to better shooting conditions: higher speed indicates less defensive pressure, as the shooter can more easily separate from defenders through movement. On the other hand, the positive correlation between speed and scoring success is also linked to the shorter reaction time available to opponents.
It would be particularly interesting to investigate whether the speed of surrounding players is also correlated with a higher scoring probability. The more movement there is, the more space can be opened and exploited. This has a major impact on the key factors of clarity and pressure. At the same time, the timing of speed or movement relative to the defender likely plays a crucial role. Both the speed and the direction of movement at the moment of the shot should ideally be opposite to that of the defender, which also reduces pressure and increases clarity.
The positive correlation between speed and scoring success may also be context-dependent. Speed is generally highest during goalscoring opportunities arising from offensive transition situations. In these situations, factors such as defensive pressure and shot clarity are also typically optimal, since fewer opponents are positioned near the goal.
2.3. Creation of Chances / Evaluating the Action Sequence Instead of the Shot Itself
Classical Expected Goals models capture only the shooting situation at the moment of the shot (as well as the type of assist). So far, they have been used to examine only the factors directly related to that shooting situation. However, the context or the build-up to the chance may be just as relevant. Some studies have identified key factors that contribute to the creation of a high-quality goalscoring opportunity.
A study by Cao (2024) investigated the extent to which passes played before a shot can serve as predictors of scoring probability. He developed a model that could approximate the likelihood of scoring based solely on pass-related parameters, without any information about the shot itself. This demonstrates that the creation of a chance also has a significant impact on conversion.
One of the foundational studies in chance evaluation, by Lucey et al. (2015), already incorporated a 10-second window prior to the shot, during which the movements of both teammates and defenders were measured. It was shown, among other things, that the speed of play and the interactions of surrounding players (i.e., the movements of attackers relative to defenders) have a decisive influence on the probability of scoring. Unfortunately, the specific magnitude of the influence of each factor was not presented in detail.
2.3.1. Creation of Chances from Possession Phases and Transition Situations
Moura et al. (2007) were already able several years ago to measure the influence of the length of a passing sequence on scoring probability. In this study, either short or very long pass sequences proved to be ideal. This generally aligns with experiential knowledge from qualitative match analysis. Very long passing sequences, after all, are a sign of high dominance and fewer recovery opportunities for the defending team.
However, football has evolved significantly since 2007. Positional play, especially popularized by Pep Guardiola, has been adopted by an increasing number of teams. Many teams now aim to control the game through possession, though they do not always succeed. One reason for this is the simultaneously evolved defensive strategies. Teams often defend deep, particularly compressing central spaces in front of their goal. As a result, the opponent’s possession is often directed into less dangerous zones, creating unproductive possession. Consequently, long passing sequences do not necessarily lead to a higher probability of scoring.
By contrast, the increase in scoring probability after short passing sequences provides evidence for the effectiveness of pressing as an attacking method. The number of passes leading to a shot following a ball recovery as a result of attacking pressing or counter-pressing is significantly lower. The improvement of counter-pressing and (attacking) pressing is therefore demonstrably a promising method to increase effectiveness in chance conversion.
To further specify the effectiveness of goals after ball recovery, Gonzáles-Rodenas et al. (2015, 2017) contributed important insights. According to their findings, the probability of scoring rises sharply after a ball recovery if there is an immediate penetration into depth. This is a clear indication of the effectiveness of runs into space after regaining possession. Very likely, the interaction of the players making these penetrating runs also plays a role. Ideally, the defensive line is placed in a dilemma by opposing directions, timing, and acceleration of the runs in depth. Correspondingly, it was found that the most successful transition moments are often initiated by passes from the central areas behind the defense. In line with this, central ball recoveries are the most promising.
Similarly, the number and positions of opponents and teammates at the moment of ball recovery have a demonstrably strong influence on scoring probability. This also represents one of the major advantages of man-marking in attacking pressing. If the ball is won as a result of man-marking, deep positions are automatically occupied, creating numerical superiority for the attacking team, as the ball-winning player is positioned ahead of their opponent. This advantage is further enhanced by the natural disorder of the defensive line following a transition. Counter-pressing provides the ideal combination once again, as the ball-recovering team is still in an offensive shape from which they can easily switch to attack, while the opponent, due to their own offensive transition, has vacated certain defensive spaces and therefore faces a dynamic disadvantage in defensive transitions.
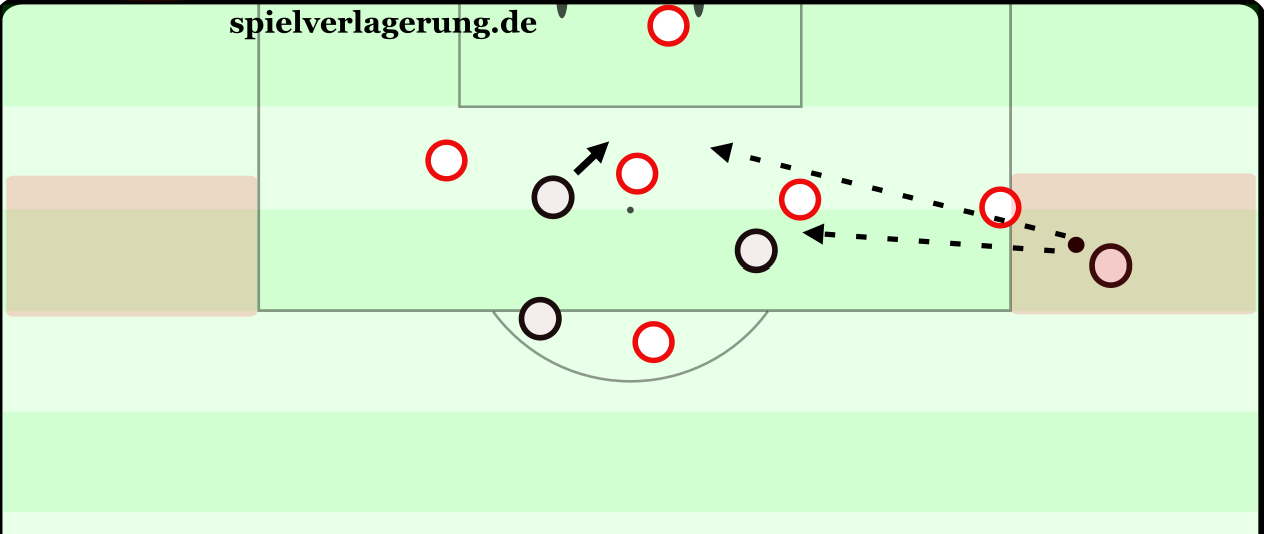
2.3.2. Effective Assist Zones in the Final Third
In further studies, Gonzáles-Rodenas et al. (2019, 2020) gathered insights into increasing effectiveness through specific assist zones from structured possession phases. To do this, goal sequences from the UEFA Champions League were analyzed. Three zones in particular are considered effective for creating goals. Passes into depth from the central attacking area are especially difficult to defend. The combination of proximity to goal, the higher probability of scoring from a central finish, the shorter reaction time for defenders, and the potential need for defenders on the last line to reorient themselves all contribute to high goal danger. This again demonstrates how promising central attacking dominance can be.
These findings are supported by the fact that more than 22% of chances created from structured possession behind the opponent’s last line result in a goal, whereas fewer than 8% of chances in front of the defensive line lead to a goal (Gonzáles-Rodenas et al., 2017). Here, the factors of clarity and defensive pressure at the moment of the shot again play a decisive role.
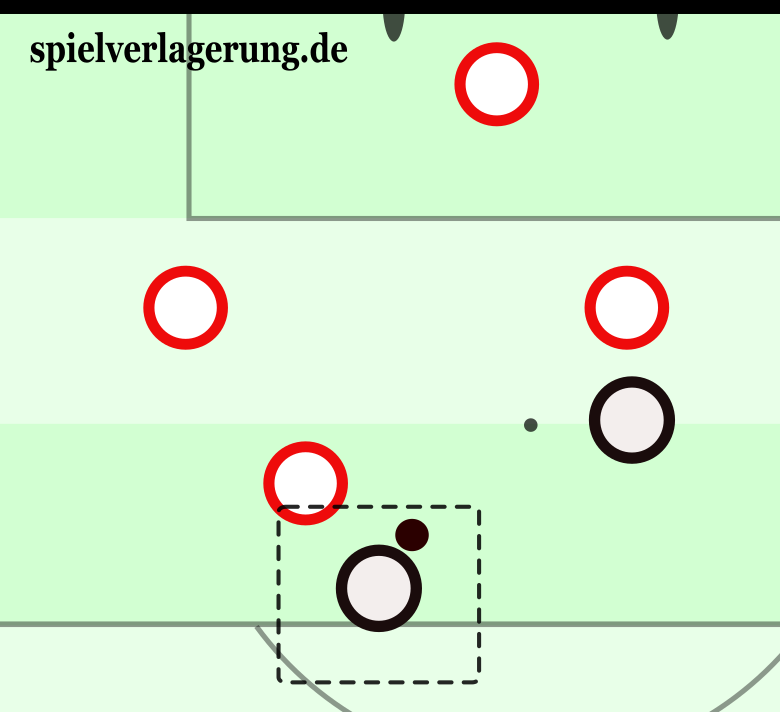
The assist zone in the central attacking area
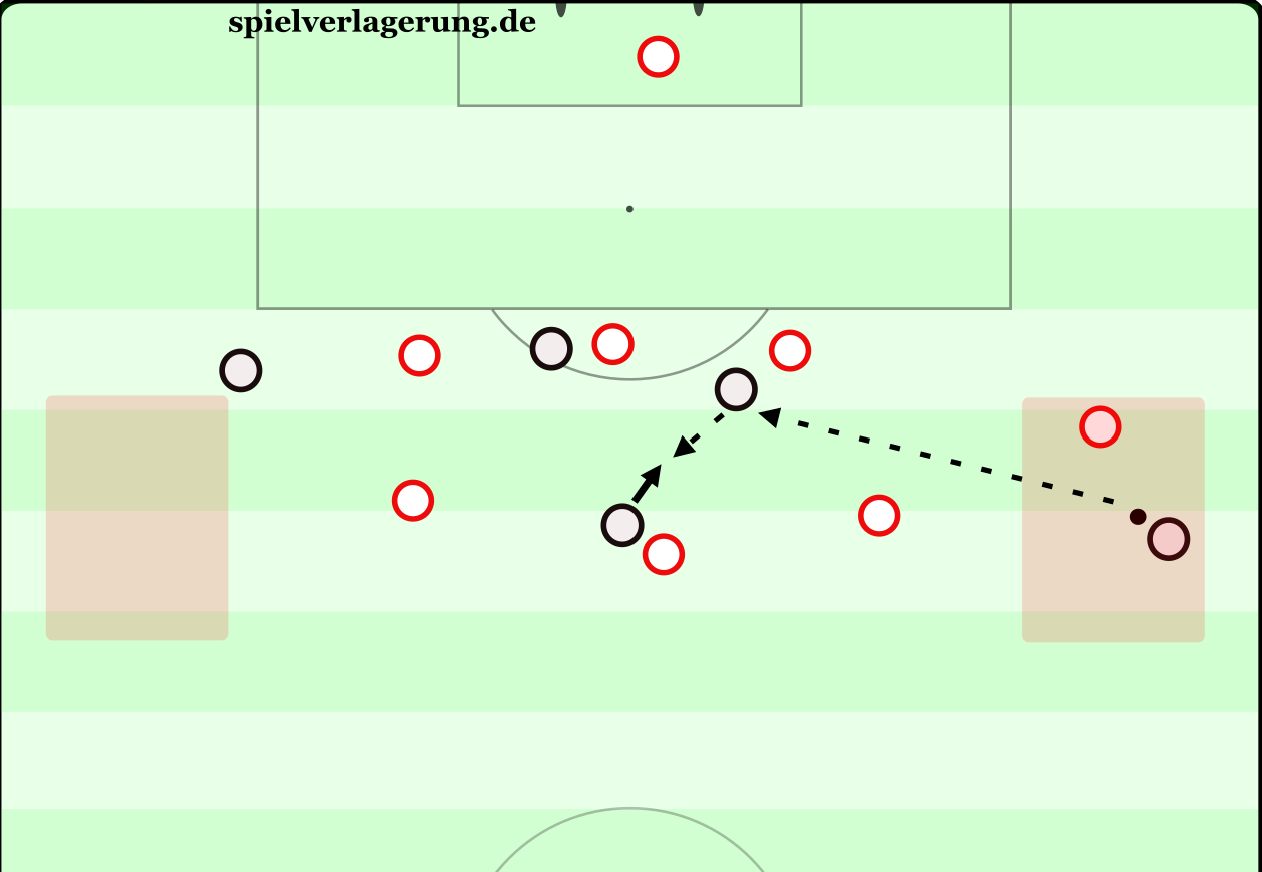
According to Gonzáles-Rodenas et al., a second effective assist zone is the area of the central, deep wide zones within the penalty area. Several advantages come into play here as well. Inside the penalty area, defenders tend to be more passive due to the risk of conceding a penalty. Furthermore, when the ball is in the deep zones, the space is no longer restricted by the offside rule, as the offside line is determined by the second-last defender. The passing angle for the subsequent shooter is also ideal, as they can start toward the ball facing the goal. This gives the attacker a dynamic advantage over defenders who are positioned sideways or with their back to their own goal. This advantage can be optimally exploited with a low, flat pass due to the proximity to goal. It would be interesting to develop a style of play that opens and occupies passing lanes into this zone in a more targeted manner.
The assist zones in the deep penalty areas
The assist zones in the wide outer areas
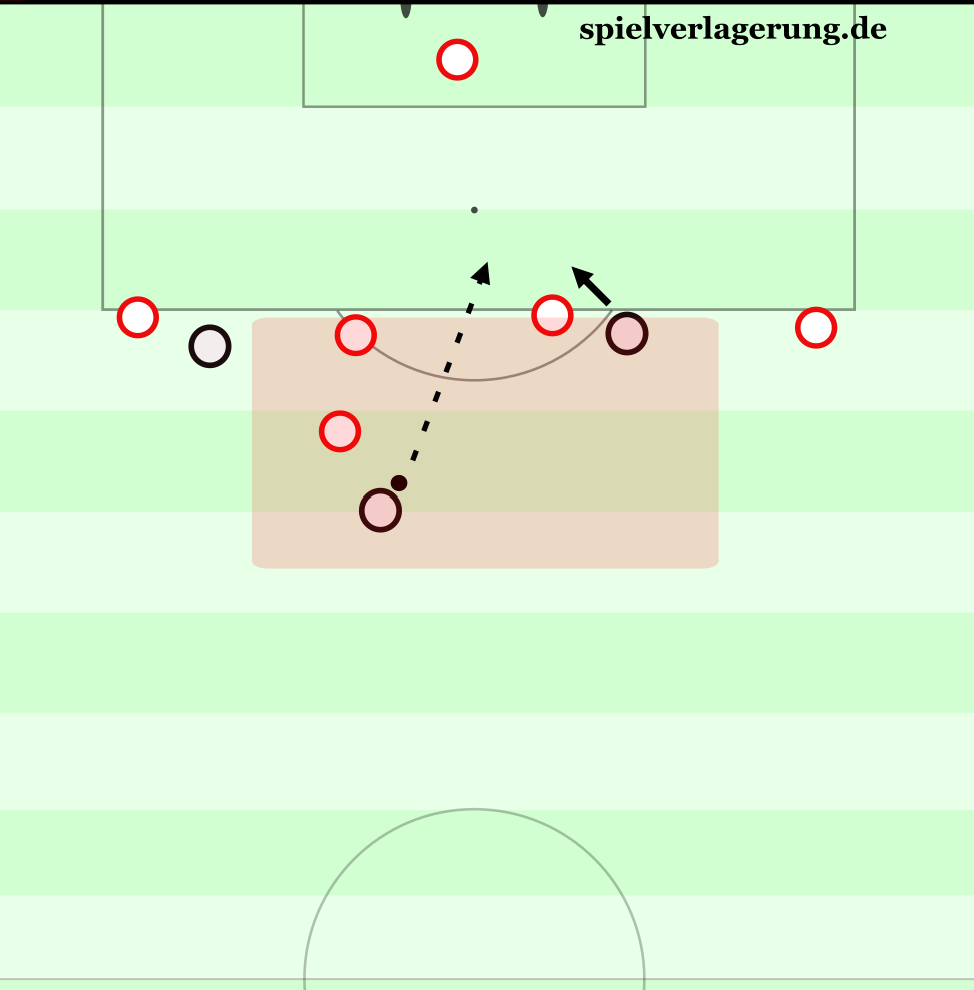
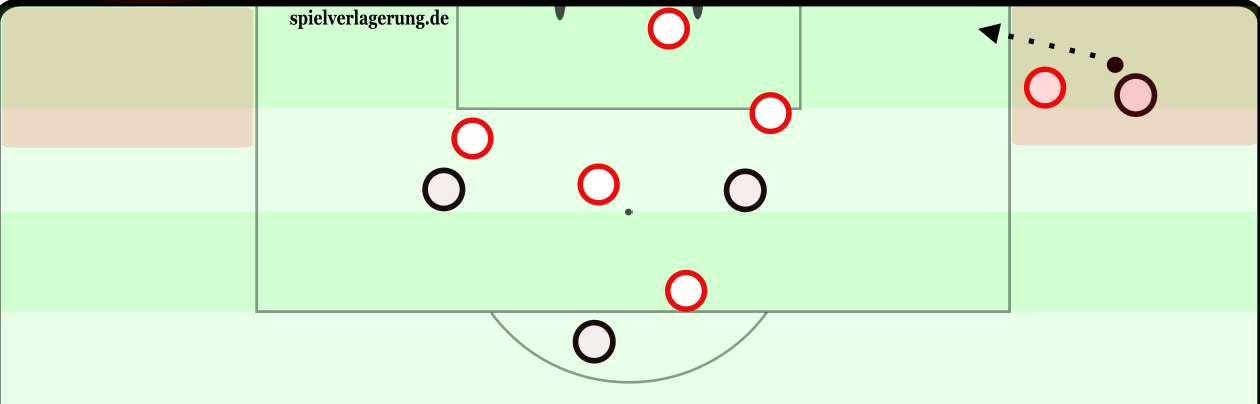
Another prominent assist zone lies in the wide areas roughly between the 16-meter line of the penalty area and the level of the penalty spot. In these wider areas, pressure on the ball carrier is minimal, while at the same time the apparent options seem limited. However, progression toward goal from here is easier than from most other areas of the pitch. The combination of evading the opponent’s pressure and the possibility of diagonal, horizontal progression toward goal makes this zone so dangerous.
The advantage of diagonal, horizontal progression is that the receiving players can more easily take their first touch from the center toward goal due to the pass angle, compared to diagonal, vertical progression. The same benefits naturally apply about 10 meters further back, but this zone does not explicitly appear in the statistics, as attacks from here are more likely to be initiated rather than finished due to the greater distance. In qualitative match analysis, the described advantages of this zone are known as the “inside diagonal.”
Use the wide/half-space zones for diagonal progression into the central assist zone
Interestingly, the wide, deep outer areas play almost no role in goal preparation. This also demonstrates that centrality in attacks is particularly important. Against a deep-lying opponent, progression through the opponent’s block via the central zones is eventually inevitable. Therefore, styles of play that only pass around or over the block are not truly effective against deep defenses. This is another indication of the importance of central attacking dominance in the football of the future.
Increase the probability of an assist from “less important” deep wide zones through 1v1 situations
2.4. Insights from Possession Value (PV) Models for Evaluating Chances from Possession Phases
Of course, broader Possession Value (PV) models, such as Expected Threat (xT), VAEP, Expected Possession Value (EPV), or On-Ball Value (OBV), also have an impact on evaluating the quality of a goalscoring chance. These measure all ball actions in a match. Particularly interesting appears to be an analysis of well-known, profit-generating actions derived from qualitative game analysis, such as half-space switches, diagonal connections, binding dribbles in the half-space, or inside diagonals into the final third, based on the OBV model and, where applicable, other complementary metrics.
The OBV model measures the change in expected goal value (xG) after each individual action and has so far been used primarily to evaluate individual player performances. However, applying this model to specific action patterns, such as half-space switches, across large datasets is still relatively uncommon. Within such an investigation, prerequisites could be identified under which the mentioned game actions are particularly effective. Unfortunately, there are hardly any studies with a comparable research design to date. Nevertheless, certain assumptions can be made based on the existing body of research.
The idea of maximizing the manipulation of the defensive line appears across different studies, measured in various ways. While Lucey et al. (2015) considered the attackers’ movements relative to the defenders as well as the number of defensive role switches in evaluating goal probabilities, Cao (2024) showed that the probability of scoring increased significantly when the ball was moved over a greater distance vertically (y-range) and/or horizontally (x-range) before the shot. The relevance of these two parameters lies in the fact that greater ball movement typically leads to a larger change in the defensive structure. Particularly effective are passes played through the opponent’s defensive shape, as they force maximum reorientation of the defense. Accordingly, diagonal connections should be highly effective.
Similarly, Goes-Smit et al. (2018) developed a metric for assessing pass effectiveness. The underlying principle here too was the idea of maximum penetration of the defensive line. This metric evaluates the extent to which the defense must reposition itself after a pass. The decisive factors turned out to be pass speed and pass length. A higher pass speed, logically, also allows the opponent less reaction time. Pass lengths between 19 and 30 meters were found to be ideal. That such long passing distances were rated highly in this metric, of course, depends on the match context, which was not accounted for here. After all, both pass length and the degree of necessary repositioning are typically greatest in offensive transition play.
Interestingly, pass angle had no significant effect on pass effectiveness in terms of defensive manipulation. This finding might initially suggest that diagonal passes, contrary to common assumptions, do not inherently add extra threat for the opponent. However, the influence of angle also depends on the definition of the reference point. Diagonality can be generated relative to the pitch as well as relative to the opponent or the preceding pass. For example, if the opponent is positioned diagonally to the passer, then a diagonal pass relative to the pitch would not be the same as a diagonal pass relative to the defender. It is highly likely that the advantages of diagonality come into play when it is used in relation to the defender’s positioning, such as body, foot, or head orientation, as well as stance. Consequently, the effectiveness of diagonality cannot, paradoxically, necessarily be measured by angle alone.
Diagonal orientation to the pitch vs. diagonal orientation to the opponent (lines of sight)
Further insights at this point, however, would go beyond the scope. After all, the aim of this article is to decipher chance conversion. The further away an action is from the goal (that is, the earlier it occurs in the course of a play) the less influence it typically has on the team’s effectiveness in the sense intended here. This section could therefore be expanded much further. After all, every means of improving the quality of a goalscoring chance also contributes to improving the effectiveness of chance conversion.
2.5. The Definition of Chances
The concept of chance conversion is inseparably linked to the definition of “goal-scoring opportunities.”
The parameters examined in this article aim to improve the quality of finishing already during the creation phase of a chance. This raises the central question of whether and to what extent the preparation of a chance should already be included in its definition. This ambiguity directly affects the evaluation of missed chances. From what point onward is a chance considered “missed”?
Spearman (2018) developed the so-called Off-Ball Scoring Opportunities model (OBSO). This incorporates missed opportunities for an assist. To measure the scoring potential of an off-ball teammate, the parameters Transition, Control, and Score were developed. Transition evaluates the probability that the ball will arrive at any given point on the pitch in the next action (assist probability). Control evaluates the likelihood that the receiving team will maintain possession of the ball. For this purpose, the Potential Pitch Control Field (PPCF) metric was created, which takes into account, among other things, the time needed to cover the distance of the pass in order to factor in the potential movements of opposing players. Score measures the probability of a goal from the position of the receiving player (the xG of the intended recipient).
The study analyzes, using this model, which players generate the most “off-ball scoring opportunities.” In addition, the model identifies individual danger zones for each player. The underlying idea of a dynamic model for evaluating goal-scoring chances highlights how important it is to include the creation phase of a chance in the analysis.
Coaches should therefore always assess chance conversion within the context of the entire game.
2.6. Athletic Abilities to Increase Effectiveness
“There is plenty of evidence that the frequency of goals scored during a match is time-dependent and systematically increases throughout the match, with a climax in the last period from minute 75 on (Alberti et al., 2013; Armatas et al., 2009; Evangelos et al., 2018).” – Memmert, Daniel in “The influence of randomness on goals in football (…)“
Alberti et al. (2013) examined league matches from the 2008 to 2011 seasons in the English, Spanish, Italian, and French top divisions. Based on this large dataset, they were able to show that the majority of goals are scored in the final 15 minutes and that goal frequency increases continuously over the course of 90 minutes.
The most obvious explanation for this phenomenon lies in the central role of physical performance capacity in professional football. Superior athleticism provides increasing advantages as a match progresses, with the greatest impact in the final minutes. Higher intensity almost inevitably translates into tactical and technical advantages. Everyone knows the picture from amateur leagues: the young player still able to sprint in the 60th minute, while the older opponents are already fading. Why shouldn’t this effect also manifest itself at the highest level? Qualitative match analysis of the first round of the DFB Cup illustrates this as well: in the first 30 minutes, lower-tier teams can often keep up, but by extra time the balance of power almost always shifts decisively in favor of the professional teams. Higher fitness therefore leads to greater effectiveness, especially towards the end of the match.
Of course, additional factors also play a role. Teams that are behind often take more risks in the closing stages, which increases the probability of scoring but also of conceding. This does not, however, diminish the significance of physical performance capacity. Another interesting question is whether fitter teams primarily create more high-quality chances at the end of matches, or whether they also convert their chances more efficiently. Both seem plausible and warrant further investigation.
2.7. Effective Playing Styles
The influencing factors on goalscoring opportunities examined so far can be systematically used to improve chance conversion. Accordingly, certain styles of play can be derived that produce higher-quality chances and thus increase effectiveness.
The studies analyzed show that transition play generates high-quality chances. The decisive factors of pressure and clarity have particularly positive effects due to the large amount of available space. The available space also enables central finishing positions. In addition, fewer passes are required to reach goal, which reduces the susceptibility to errors. Counterpressing and pressing with the aim of regaining possession rather than merely preventing counters lead to more effective transitions, since the opponent lacks structure and the ball-winning team has a dynamic advantage. The weaknesses of transition play lie less in chance conversion itself and more in the limited number of chances that can be created from transitions.
The data clearly shows why positional play faces such difficulties against deep-lying opponents. When teams are pushed back into their own defensive third through positional play, they congest central spaces and thereby reduce the likelihood of high-quality chances. The objective of positional play, to find a free player, is no longer effective in this context for creating high-quality chances. After all, the dangerous central spaces are rarely opened up against a compact, deep-lying opponent. Similarly, the factors of clarity and pressure have particularly negative effects.
In the future, an alternative approach will be necessary to counter these problems. The key may lie in achieving central attacking dominance, which leads to better finishing positions. To establish this, players will need to be superior in 1v1 duels with the ball in central areas. Accordingly, the development of players who are strong in central 1v1 situations will become increasingly important. Likewise, a dynamically shifting structure with different reference points for player positioning could be beneficial. Instead of orienting positioning toward finding the free man through pulling defenders out of shape, as in classical positional play, it may be more effective to structure positioning around the best possible connections between teammates for (ball) combinations through tight spaces.
However, the current data basis is not sufficient to predict future developments. At present, data can only capture what is already observable in match play. Future styles of play that may prove particularly effective will inevitably remain outside the boundaries of current research. The explanatory power of existing studies is thus always tied to the current stage of football’s evolution. For this reason, it remains uncertain how certain possession strategies, such as a more diagonally oriented approach or a consistent focus on central possession dominance, will perform in the future.
Another problem with the current research and existing models is the often limited size of datasets. These are usually restricted to a single league, competition, national teams, or even just one club. Since different football cultures prevail in different countries, certain playing styles are not adequately captured. The effectiveness of a style in Brazil, for instance, may be characterized by different traits than in Europe’s top leagues. This phenomenon is well known in AI research as “garbage in, garbage out” (GIGO), meaning that bias in the data inevitably creates bias in the model.
In summary, when coaches criticize their team’s chance conversion, they should first analyze the quality of the chances based on the findings outlined above. Depending on the team’s individual context, chance creation can then be adapted so that chances are more likely to result in goals.
3. Efficiency of Chances – Making Optimal Use of Existing Opportunities
Efficiency means converting as many goals as possible from the chances created. Statistically, it is very difficult to consistently outperform one’s actual xG value over a long period of time. The actual xG value is a theoretical ideal of goal probabilities, accounting for all factors, but in practice it cannot be measured with complete precision. Accordingly, the effectiveness of chances plays such a major role in chance conversion. After all, over a large dataset or a longer period of time, actual outcomes (goals) tend to converge toward probabilities (chances). This phenomenon is known as the law of large numbers.
However, in smaller samples or over shorter time spans, natural deviations can occur. This means fluctuations in efficiency can arise, leading to temporary overperformance (more goals than xG) or underperformance (fewer goals than xG). With a sufficiently large number of chances, according to the law of large numbers, the deviation in efficiency from the actual xG values approaches an expected value of zero (no over- or underperformance). Consequently, there are two different approaches to training efficiency: compensating for negative fluctuations over shorter periods (i.e., short-term poor chance conversion) and sustainably increasing the goal probability per chance.
To achieve the latter, the probability of scoring from a chance must be improved relative to the average. This is a very difficult task, since many xG models show that only very few players can consistently exceed their expected xG value. Most successful scorers are instead characterized by high effectiveness through better shot locations and thus higher overall xG values, rather than by above-average efficiency.
3.1. Increasing Efficiency Sustainably
Being able to sustainably increase efficiency offers enormous competitive advantages. Many studies show that the ratio between shots and goals, the chance conversion, is one of the most important differences between successful and unsuccessful teams. Delgado-Bordonau et al. (2013) found that a team’s goal conversion rate serves as one of several factors in predicting team success.
Souza et al. (2019) examined a wide range of statistical indicators in their study to identify the factors that best explain the league standings of clubs. Their analysis was based on a comprehensive dataset covering eight LaLiga seasons. The results show that shooting accuracy, defined as efficiency, correlates most strongly with actual offensive performance, while preventing high-quality chances had the greatest impact on actual defensive performance.
Dufour et al. (2017) also investigated a wide variety of indicators and their relationship to team success at the 2014 World Cup. One of the decisive indicators that differed between successful and unsuccessful teams was shooting efficiency. The study concluded: “This study revealed that shooting efficiency was the factor that made the difference during the 2014 FIFA World Cup.”
It can therefore be concluded that improving efficiency can be highly rewarding.
3.1.1. Improving Efficiency – Is It Possible?
That chance conversion (efficiency) can be improved and systematically trained can be demonstrated, among other things, by the study of Deb & Dey (2019). In their study, they developed a model to measure the goal probability of a shot based on data from the 2016/17 MLS season. As part of their analysis, they introduced two player metrics:
-
Shooting Prowess (SP) measures individual finishing ability, which in this article is equated with players’ individual efficiency.
-
Positioning Sense (PS) measures the ability to get into good shooting positions, which in this article is considered part of effectiveness.
Interestingly, the evaluation of these two metrics revealed not only that Positioning Sense, already included in well-known xG models, correlated positively with goal probability, but also that players who registered more shots on target per game tended to be more efficient in their finishing. It was also found that defenders were generally less efficient than forwards when shooting (excluding headers), since they usually had fewer shots per game.
The correlation between player efficiency and the number of shots taken is likely due to the recognition of situations through practice. The central takeaway of the study for this article is therefore that efficiency varies from player to player and can be systematically improved. A comparison between the top scorers and the players with the highest PS and SP scores, incidentally, showed strong overlap, supporting the precision of the developed metrics.
Since efficiency varies among players, it seems plausible that quality differences between teams also influence efficiency positively or negatively. For example, it would make sense if Bundesliga clubs were able to exceed their xG values, especially against weaker opponents. Furthermore, most xG models are based on data from top leagues. Consequently, it also seems plausible that top teams can perform more efficiently over longer periods of time than their expected goals (xG) would suggest.
The influence of team quality differences on goal probability is addressed in the study by Wheatcroft & Sienkiewicz (2021). They developed a model to predict the goal probability of a team’s shots, which explicitly incorporates team efficiency. Ultimately, the predictions derived from this model proved superior to a comparable model that assumed the same shot success probability for all teams. However, the model did not include specific positional data of shots, as is customary with xG models. For this reason, a direct comparison between their model and xG models is difficult. Moreover, the study does not clarify to what extent team strength affects goal probability.
Tony ElHabr, data scientist, builds on insights from Ryan Brill (NESSIS Talk 2023) in his article “Should we account for team quality in an xG model”. Brill showed that Expected Points (EP) models in the NFL are systematically biased: they underestimate strong teams and overestimate weak teams because team strength has not been accounted for. ElHabr transfers this idea to football. For the Premier League 2022/23 season, he calculated xGD values (goals minus xG). The results show that the six best teams had strongly positive values, while the six weakest teams had strongly negative values. This suggests that xG models in football also distort team strength.
However, incorporating team strength via ELO ratings led to little improvement in the cited article’s xG models. The more likely explanation is that a more precise metric, one that better reflects a team’s current performance, would enable much greater progress. After all, ELO ratings capture team strength over longer periods and may inadequately reflect short-term fluctuations in form. For instance, Lars Maurath (“Do Naive xG Models underestimate Expected Goals for Top Teams?”) showed that simply including the number of shots taken by a team can already improve an xG model. While this indicator does not fully capture actual differences in team quality, the findings clearly support the idea that team strength should play a significant role in assessing goal probabilities.
Even so, ElHabr argues against directly incorporating team quality into xG models. One of his arguments is that the comparability of xG values between teams would suffer, since adjustments integrating team strength would weight chances differently. In such a model, a chance created by a weaker team would count less than the same chance created by a stronger team. Nevertheless, it remains true that better teams not only create more chances but also convert them more efficiently. This insight underlines the importance of training efficiency in a targeted way.
3.1.2. How Can Efficiency Be Improved?
In order to sustainably increase efficiency, despite the difficulties described in the introduction to this section on efficiency, various approaches can be considered. Two interconnected factors, chance individualization and spatially oriented finishing quality, may be decisive in enabling teams to outperform their expected goals (xG) values.
Several studies have identified an asymmetry in successful shots (Mead et al., 2023; Anzer & Bauer, 2021). There are more goals scored from slightly left of center than from slightly right of center. This is most likely due to the fact that there are more players with a stronger right foot, who can logically shoot more effectively from a position slightly left of center, since the shooting angle is more favorable to the goal. The key insight here is that players must be brought into shooting situations that match their individual strengths (chance individualization). In line with this, Spearman (2018) found that certain players have specific danger zones (spaces) from which they score the majority of their goals (spatially oriented finishing quality).
The factor of individual, spatially oriented finishing quality is therefore crucial, as shown. For example, Lionel Messi has been able to exceed the ordinary xG value from the right half-space (Davis & Robberechts, 2024). Messi can optimally exploit his 1v1 strengths from the right wing, where he can cut inside onto his strong left foot to take a shot. Because he has been able to use this so frequently, his efficiency also increased. Similar examples would include Arjen Robben at Bayern Munich or Mohamed Salah at Liverpool. Such individual abilities can thus be deliberately leveraged to increase the probability of scoring from a shot.
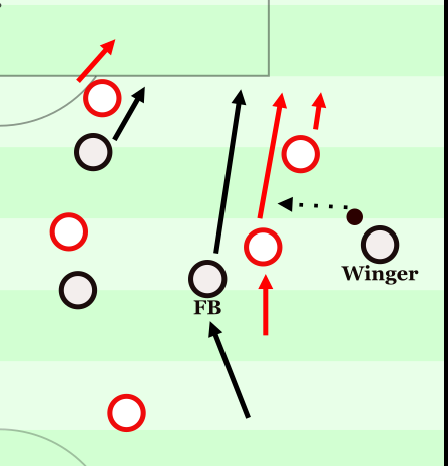
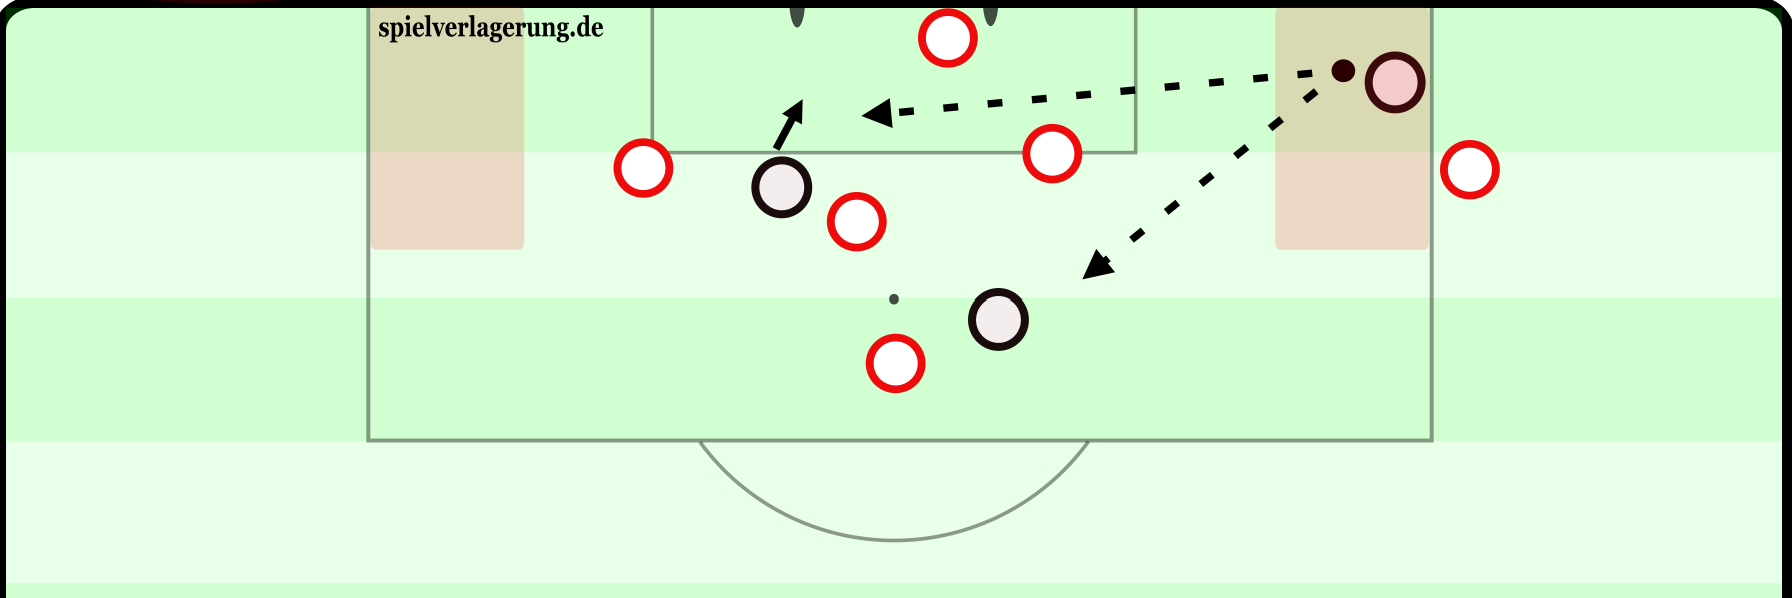
An example of teammates creating space in the dangerous area for the winger.
It would be interesting to investigate whether the individual player strengths identified by Spearman (2018) in certain spaces are also reflected in specific movement timings as well as in the players’ individual speed, acceleration, or deceleration.
Deliberately deploying players according to their strengths to improve chance conversion clearly holds significant potential. For example, at Manchester City, Haaland is often played behind the defensive line due to his explosive power and physicality in the penalty area, allowing him to reach the ball from an optimal position ahead of his defenders. In contrast, Harry Kane, lacking the same initial burst, tends to use counter-movements to gain a timing advantage. Accordingly, the ideal style of play for a team and the behaviors of the teammates should differ depending on the striker, in order to consistently bring each forward into the best possible scoring positions.
3.1.3. More Efficient Finishing: Evaluating Shots with Post-Shot Expected Goals (PSxG) Models
Another way to increase efficiency could lie in the finishing itself. The “Post-Shot xG” (PSxG) model (also known as Expected Goals on Target [xGOT]) enables the evaluation of the shot rather than the pre-shot situation. Unlike the previously presented pre-shot xG models, PSxG uses information after the shot has been taken to assess how dangerous the attempt was. Essentially, PSxG allows a better evaluation of goalkeeper performance. It takes into account the two factors already known from pre-shot xG models, distance and angle to goal at the moment of the shot, along with the shot’s position coordinates at the “impact point.” A shot that misses the goal, logically, is assigned a PSxG value of 0.
In most PSxG models, the goalkeeper’s position is deliberately not considered, as this would distort the evaluation of the goalkeeper’s performance. A well-positioned goalkeeper would lead to lower PSxG values, paradoxically making their performance appear worse in the model. For evaluating the shooter, however, including the goalkeeper’s position would actually be important, as it can be decisive for the quality of the finish. Newer models also incorporate the ball’s speed and trajectory, allowing for more detailed insights into the shooter’s performance.
Stats Perform data show that certain players can consistently exceed their pre-shot xG values with their post-shot xG values (= xGOT values) over multiple seasons. Stats Perform calls this combined metric Shooting Goals Added (SGA). Compared to previous metrics, such as Goals Above Average (GAA), SGA has the advantage of including all shots a player takes, thereby increasing the sample size and reducing the likelihood of statistical outliers. In contrast, GAA compares the relatively rare goals a player scores, which are influenced by randomness, with their xG values (Davis & Robberechts, 2024).
The fact that players achieve positive SGA values over long periods demonstrates that it is indeed possible to finish more efficiently than average over time. These values can likely be explained by the previously described factors of chance individualization and space-oriented finishing quality, which may allow players to generate high post-shot xG values from positions or actions with lower pre-shot xG values.
Despite their usefulness, PSxG values are not yet developed enough to draw fully reliable conclusions about individual shooters. One distorting factor could be the number of shots taken, which can create statistical outliers. A player’s total shots on goal over an entire season may remain relatively low depending on their position. Another potential distortion comes from missing relevant metrics in PSxG models, which may cause specific shooting patterns to go undetected.
De-la-Cruz-Torres et al. (2025) developed the Expected Shot Impact Timing (xSIT) model, which, in addition to goalkeeper and field player positions, also accounts for shot clarity. This is defined by the free area of the shooting triangle between the shooter and the two goalposts, reduced by blocking players and their movement radius. Additionally, ball speed and the average reaction times of goalkeepers (230 ms) and field players (250 ms) are included to account for potential defensive actions. By applying such advanced models to large datasets, it may become possible to gain more detailed insights into shot quality in the future.
In summary, it can be stated that the finishing itself can also be leveraged to sustainably increase efficiency.
3.2. Preventing Short-Term Fluctuations in Efficiency
To prevent phases of low efficiency for a team or a player, it is sensible to limit potential fluctuations as much as possible in advance. Short-term efficiency fluctuations over several matches primarily result from a high variance between goals scored and Expected Goals. The greater this variance, the more pronounced the deviations can be, both upwards (overperformance) and downwards (underperformance). While positive deviations have an immediate beneficial effect on the match outcome, long-term stability primarily depends on limiting negative deviations.
Accordingly, the central question is how this variance can be stabilized at a consistently low level. It should be noted, however, that due to the random nature of goal-scoring opportunities, variance can never be completely prevented, only reduced. The role of randomness in chance conversion will be discussed in more detail in a later section.
3.2.1. Influence of Team Cohesion and Rotations on Efficiency Fluctuations
To reduce variance and thus prevent short-term efficiency fluctuations, the factors of team coherence and instability caused by rotations could play a central role.
Team coherence can be understood as the level of coordination and collaboration within a team. It is shaped by a variety of influences. On a psychological level, factors such as team morale, hierarchies, and the degree of cohesion and group dynamics come into play. On the purely sporting level, clearly defined role distributions, practiced routines, and familiar spatial structures can be decisive for coherence. Because the concept of team coherence cannot be operationalized precisely, direct statistical analysis is naturally more difficult.
Psychological factors, such as rituals, achieving a flow state, or priming through typical teammate behavior, could explain why team coherence may influence efficiency. Studies indicate that such factors have a measurable positive effect on team performance (see Martiny et al., 2023). Through this indirect pathway, they could also prevent short-term negative efficiency fluctuations by reducing the likelihood of extreme deviations. Good team coherence could therefore be an important component in limiting short-term efficiency swings.
The factor of instability through rotations, closely linked to the sporting aspect of team coherence, does not refer to substitutions during matches. These can be useful, for example due to proven increases in intensity (see Pan et al., 2023). Rather, rotations refer to frequent changes in starting lineups across multiple matches. Such rotations have been shown to negatively impact performance (see Bekris et al., 2019). One likely reason behind this effect is that the development of practiced routines is slowed, thereby impairing team coherence. Nevertheless, a low rotation rate does not automatically guarantee high team coherence; it is merely a contributing factor. Likewise, a high rotation rate does not necessarily imply low team coherence.
There is also some evidence that rotations affect efficiency. For example, Carling et al. (2014) show correlations between rotation patterns and efficiency. Their study examined “squad management, injury and physical, tactical and technical match performance” of a football team in the French Ligue 1 during the 2008–2013 seasons. In the 2010/11 season, the team won the French championship. The study shows, among other things, that the fewest players were used in the championship season, which the authors attributed to a low number of injuries in the squad.
At the same time, Carling et al. (2014) note: “In contrast and perhaps surprisingly (…) the team’s performance in virtually all of the selected attacking KPI was not highest during the championship-winning year despite a statistically significant difference across the five seasons. Only the ratio of goal attempts on target to goals scored (…) was best in 2010/11 (…). This result partly confirms that attacking success at elite levels can be linked to a greater efficiency in converting goal attempts into goals (Collet, 2013; Rampinini et al., 2009).”
Although the evidence is currently limited, the effect appears both psychologically plausible and intuitively understandable from a football-tactical perspective. Further investigation, whether quantitatively using larger datasets or qualitatively through in-depth analyses of various teams, therefore seems sensible. Various study designs could provide indications of the influence of team coherence on efficiency. For example, an investigation could examine the impact of an above-average number of rotations due to injuries on a team’s efficiency fluctuations.
3.2.2. Counterintuitive chance conversion of National Teams
To test the hypothesis that team coherence and rotations influence efficiency, I examined the chance conversion of national teams. The basic idea is that national teams, due to fewer matches and more frequent rotations, should exhibit lower efficiency than club teams.
Opta data (“5 Key Differences Between International and Club Football”) initially confirm that national teams indeed rotate more frequently. At the same time, a comprehensive data analysis by Opta shows that more goals are scored and more shots are taken in national team matches. Interestingly, the quality of goal-scoring opportunities (xG per game) and the average quality of shots (xG per shot) is higher for club teams. Opta concludes from this that national teams are more efficient in converting chances than club teams.
This counterintuitive efficiency of national teams contradicts the initially formulated hypothesis.
One possible explanatory factor, however, could be the influence of differences in team quality on efficiency, as described in the previous section. On average, national teams have significantly larger performance gaps than club teams within a league. Thus, differences in team quality may outweigh the effect of team coherence. It is conceivable that such performance disparities have a stronger impact on efficiency than team coherence.
3.2.3. Influence of Quantity and Quality of Chances on Efficiency
To reduce efficiency fluctuations, studies that measure both the quantity and quality of a team’s goal-scoring opportunities are particularly relevant. Mathematically, it makes sense to increase the probability of scoring through fewer, but higher-quality chances. For example, two chances with an xG value of 0.8 would be more promising than eight chances with an xG value of 0.2.
Although the total xG value, calculated as the sum of all xG values, is identical in both scenarios (2×0.8 = 8×0.2=1,6), the probability of failing to score is higher with many small chances than with a few high-quality chances. To illustrate theoretically: two chances with an xG of 80% (=0.8) have a 4% probability (=0.04) of not resulting in a goal (0.2×0.2=0.04). Eight chances with an xG of 0.2 (=20%) have a 16.8% probability (=0.168) of not resulting in a goal (0,88=0.168). Even though this assumption is somewhat limited by the fact that chances are not always independent in practice, this calculation demonstrates the influence of chance quality on conversion.
Evidence for this can also be found in the study by Anzer & Bauer (2021). Among other things, they analyzed the relationship between quality and quantity of Bundesliga teams in the 2019/2020 season. The figure presented in their study is shown below. Quality is represented on the X-axis by average xG per shot, while quantity is represented on the Y-axis by shots per game. Additionally, the numbers on the club crests indicate the total goals scored by the team at the end of the season.
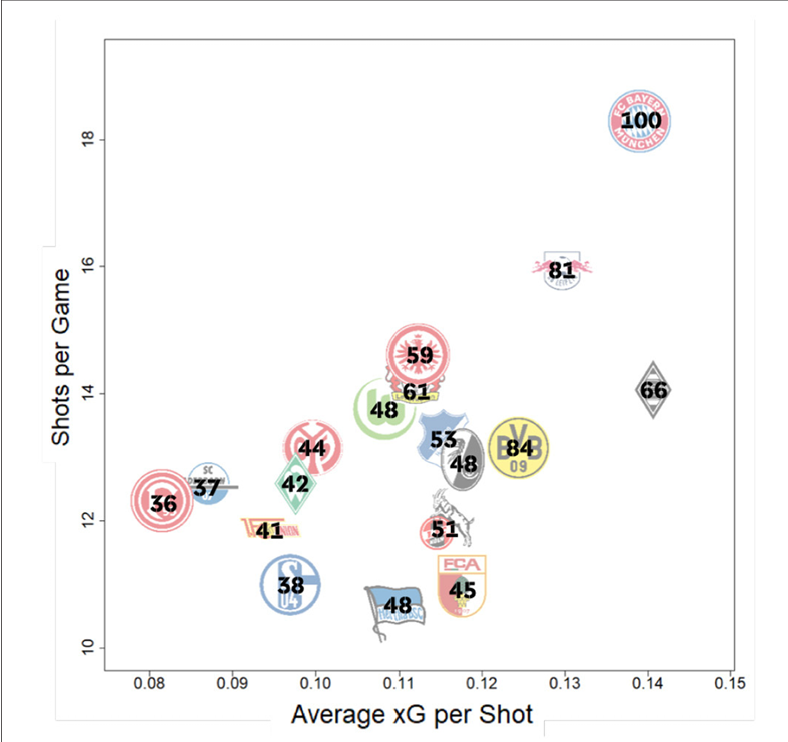
Source: Reproduced from Anzer & Bauer (2021), A Goal Scoring Probability Model for Shots Based on Synchronized Positional and Event Data in Football, Frontiers in Sports and Active Living. License: CC BY 4.0.
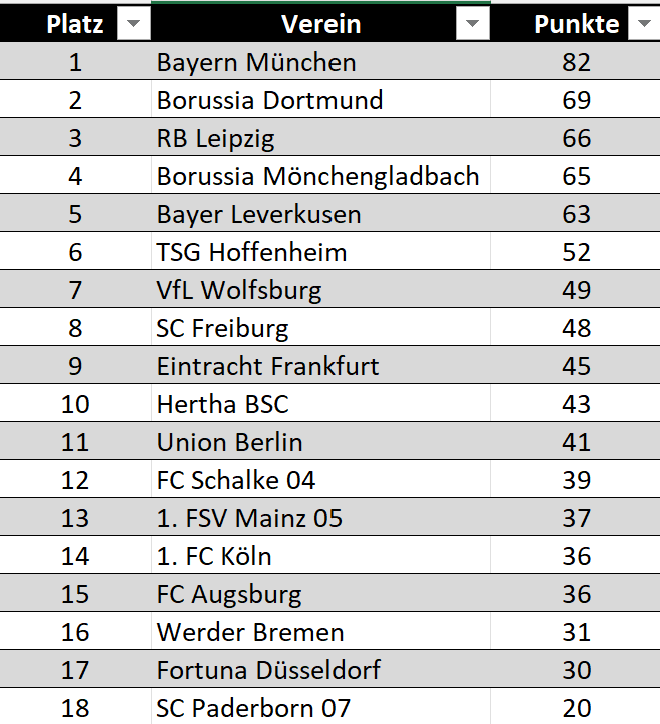
Bundesliga Table 2019/20
Compared with the additional Bundesliga table I included for the 2019/20 season, it becomes clear that the top four teams in terms of goals and points (Munich, Dortmund, Leipzig, Gladbach) distinguish themselves from the rest of the league primarily through the quality of their chances, not necessarily through the quantity. Of course, it should be noted that Munich and Leipzig stand out in both quality and quantity. Conversely, the bottom two teams in goals and points (Düsseldorf, Paderborn) distinguish themselves from the rest of the league through the lower quality of their chances, not through quantity. Although Berlin has the fewest shots per game, they still appear in the mid-table in terms of points and goals. These results emphasize the importance of the quality of goal-scoring opportunities.
Since goal conversion in football is carried out by humans rather than robots, it may practically make more sense not to concentrate the pressure of finishing on a few situations, despite the findings above, but to distribute it across multiple chances. This minimizes the risk that individual misses will decisively affect the game. Additionally, the role of randomness in chance conversion, which is discussed in more detail later in this article, ensures that a few high-quality chances alone are not sufficient for good efficiency. Consequently, the quantity of goal-scoring opportunities must also influence efficiency.
Lars Maurath shows in his article (“Do Naive xG Models underestimate Expected Goals for Top Teams?”) that teams with a low number of shots tend to exhibit larger deviations between goals and xG. Since teams with few shots deviate more frequently from expected goals, it can likewise be concluded that a certain minimum number of chances is necessary to reduce short-term efficiency fluctuations. This demonstrates that the quantity of goal-scoring opportunities has a decisive impact on preventing short-term efficiency swings. How does this finding relate to the earlier conclusion that fewer high-quality chances are better than an equivalent sum of lower-quality chances?
It is very likely incorrect to assume that quantity opposes quality. The two factors do not necessarily exclude each other. There should be a minimum number of chances to minimize efficiency fluctuations, while simultaneously maximizing the quality of those chances. In any case, it can be concluded that both quality and quantity influence a team’s efficiency, albeit in different ways. Quality is a means for sustainably improving efficiency, whereas a minimum quantity prevents short-term efficiency fluctuations and thereby reduces negative efficiency deviations.
3.3. Coping with Temporary Underperformance Despite Optimal Conditions
Even under optimal conditions, short phases of underperformance cannot necessarily be completely avoided. The challenge in these situations lies in not overinterpreting short-term fluctuations while simultaneously assessing whether the aforementioned structural influences on efficiency explain the underperformance.
Depending on the individual situation, different approaches may be appropriate. A player struggling with low confidence due to a temporary dip in efficiency should experience a higher goal probability in training. For other players, these approaches could even be counterproductive. There are, in fact, no objective standards that would be universally effective. However, it is also clear that excessive “fine-tuning” during such phases increases the risk of long-term instability.
The probably biggest mistake in training chance conversion is focusing on it only during weak efficiency phases. By preventing extreme fluctuations, sustainably increasing efficiency, and improving effectiveness through high-quality goal-scoring opportunities, the focus of chance conversion training should lie in average or above-average phases.
4. Using Randomness
A topic that was already mentioned at the beginning of the article is the role of randomness. In football and in chance conversion, randomness can indeed be decisive. This is primarily because football, compared to other sports, is a “low-scoring game.” Fewer goals have a significant impact on the final result, meaning that a small number of actions often determine the outcome of the match. This very characteristic is part of football’s appeal, as it allows weaker teams to occasionally beat stronger opponents.
The goal of the coach and team management is usually to minimize the role of randomness and thereby increase the likelihood of scoring a goal. It seems logical to increase the number of goal-scoring opportunities to also raise the probability of scoring. However, generating many chances does not always guarantee a higher goal output. This is also where the previously described misconception of some coaches comes into play. On the contrary, substantial evidence suggests that the relationship between shots and goals, chance conversion, is absolutely decisive and represents one of the key differences between successful and unsuccessful teams (Delgado-Bordonau et al., 2013; Carling et al., 2014; Dufour et al., 2017; Souza et al., 2019).
In addition to increasing effectiveness and improving efficiency to minimize randomness, there may be another way to enhance the chance conversion that is ultimately decisive for the outcome of a match. Instead of minimizing randomness, it could be influenced and harnessed in one’s favor. The goal would then be to maximize “intentional randomness” to improve goal-scoring rates. To better understand this potential style of play, it is first necessary to clarify what exactly defines randomness in football.
4.1. The Role of Randomness – An Examination
The studies by Wunderlich et al. (2021) and Lames (2018) make an important contribution to operationalizing the concept of randomness in football. Both studies define randomness in goal scoring based on six specific variables:
-
Deflection: Deviation of the shot trajectory that leads to a goal
-
Rebound: Off the post, crossbar, goalkeeper, or other players, directly resulting in a goal
-
Goalkeeper involvement: Deflection of the shot by more than 45°
-
Post/Crossbar: Shots resulting in a goal directly after hitting the post or crossbar
-
Distance: Goals scored from outside the penalty area or the penalty arc
-
Defense: Own goals, immediate “assists” from defenders, or immediate “assists” for assists by defenders despite ball control
These defined variables lie outside the significant influence of the attacking team and thus define randomness. Nevertheless, there are certain assumptions that limit the results of the studies. On the one hand, some features contain inaccuracies. For example, a goalkeeper deflection of more than 45° does not capture all goalkeeper errors. Similarly, the deviation of a shot trajectory is not necessarily the decisive factor for a goal, and direct free-kick goals from outside the penalty arc are not unplanned. On the other hand, the boundary of randomness is blurry. Determining when the attacking team no longer controls the ball action can be complicated by pressing strategies. Successful pressing from the pressing or attacking team leads to an intentional (controlled?) ball loss by the opponent, yet the subsequent action is still significantly influenced by the defending team.
Despite the challenges in operationalizing randomness, the results of these studies are highly informative. Even if the studies cannot provide exact numbers for all goals influenced by randomness, the trend is clear: randomness plays an enormously important role in football and in chance conversion. According to these studies, nearly 50% of all goals involve at least one of the defined randomness variables. Of these, the highest proportion, around 23% of all goals, is attributed to the “defense” variable, which can likely be partially traced back to successful pressing actions. Nevertheless, the proportion of goals influenced by randomness remains very high.
It was shown that a large share of goals, about 48%, even from open play, are influenced by randomness. Furthermore, the influence of randomness on goals has steadily decreased over time (49.5% in the 2012/13 season; 43.5% in the 2018/19 season). This result highlights that the tactical development of offensive play has significantly advanced over the last 15 years. Less randomness in goal scoring also implies higher-quality goal-scoring opportunities, even against more effective defensive strategies.
It was also demonstrated that weaker teams benefit proportionally more from randomness than stronger teams. This finding is logical, as stronger teams create higher-quality scoring opportunities in which the defense has less influence. Particularly interesting is the observation that randomness is especially high in matches with a tied score. This aligns with the finding that lower performance differences between teams lead to a higher proportion of randomness-influenced goals. In “close” matches, there are fewer “clear” goal-scoring opportunities, which are less affected by randomness.
A follow-up study analyzing the influence of randomness in more recent seasons would be highly interesting. The trend of decreasing randomness seems to contrast with the fact that the level in the Premier League has become more balanced, which, according to the findings mentioned above, would imply more randomness. At the same time, in earlier seasons, goals scored by Manchester City, Liverpool, and Arsenal were statistically weighted more heavily due to their dominance, representing a large share of all Premier League goals. Therefore, in those seasons, randomness was likely less significant. In the 2024/25 season, the dominance of the strongest teams was less pronounced. If randomness has nevertheless decreased, this would suggest a more controlled style of offensive play.
Lars Maurath, in his article “Do Naive xG-Models underestimate Expected Goals for Top Teams?” also concludes that a “perfect” xG model without bias cannot accurately predict the actual goals scored. Depending on the number of shots, larger or smaller deviations between actual goals and expected goals are normal. He finds that the expected fluctuations (95% confidence interval) over 10 games are around ±50%. After a season, assuming 450 shots per season, the prediction still fluctuates by ±20%.
The 95% confidence interval means that in 95% of cases, goals fall within the specified range. In 5% of cases, goals fall outside this range, for example, outside ±20% in a season. Maurath attributes these deviations to the influence of randomness in goal scoring, which cannot be predicted by a probabilistic model. Because fluctuations are greater with fewer shots, weaker teams with fewer goal attempts are more affected by randomness in scoring.
As described in the introduction, this article aims to provide strategies to improve chance conversion. Randomness can also be deliberately leveraged to score more goals, both in goal preparation and in goal execution.
4.2. Randomness vs. Luck in Football
To deliberately leverage randomness, it is first necessary to distinguish between the two components: randomness and luck. In the studies, measured randomness is described as “uncontrolled” or “unplannable.” Since planability in football can be mistakenly interpreted as “pre-play considerations,” randomness is defined here as “not within the significant influence of the attacking team.” Even this definition does not draw a clear line between random and non-random game situations. However, randomness in football is not a binary concept (randomness vs. no randomness) but rather a continuum. Game situations can exhibit varying degrees of randomness. Determining when a situation is considered random is ultimately subjective. One could even argue that all actions in football are influenced by randomness, since they depend on the opponent’s behavior.
Luck, on the other hand, refers to a situation in which “a goal occurs despite a low, real probability of scoring”. The real probability of scoring represents a theoretical ideal value for expected goals. A goal can therefore be random but not lucky. For example, a shot that strikes the post or crossbar has a relatively high probability of resulting in a goal but can still be considered random. Similarly, the likelihood of successfully converting a rebound can be increased by a higher number of attackers in the penalty area, yet the goal remains random because the rebound is not under the direct control of the attacking team.
Conversely, a goal can be lucky but not random. For example, scoring from a free kick is usually associated with a low probability of scoring, but it is within the significant influence of the shooter. From these assumptions, a style of play can be developed that is influenced by randomness but does not rely on luck.
4.3. A Random but Not Luck-Based Playing Style
“Goals in football (…) are not considered to be purely random, even if some random influence was involved in the goal scoring process. This means that certain tactical approaches might favour or hamper the occurrence of random goals. A tactical approach could be not to aim at perfectly controlling all offensive actions but to intentionally create uncontrollable situations in order to gain the opportunity to score random goals.“ – Memmert, Daniel in “The influence of randomness on goals in football (…)“
A playing style based on randomness would be particularly useful for underdog teams. When individual offensive qualities are lacking, it is especially difficult to create high-quality scoring opportunities from controlled possession. Therefore, most teams in situations of inferiority focus heavily on transition play. However, in a match, there are quantitatively fewer transition opportunities to score a goal than there are chances from controlled possession. Consequently, it would be a major advantage to also be able to generate scoring opportunities from possession situations by maximizing randomness.
The goal of this style of play is to be better prepared for randomness. By deliberately creating chaotic game situations, randomness is maximized. The advantage, or the reduction in required luck, arises from the fact that the team is better prepared for the created chaos. Players who can recognize situations more quickly gain a significant advantage over their opponents. By forcing the opponent into uncontrolled, chaotic situations, their structural superiority becomes less relevant. The aim is to alter the entire game so that the opponent cannot execute their typical patterns as usual.
Scoring efficiency benefits from maximizing randomness primarily through improved effectiveness. Due to the lack of predictability, it becomes harder for the opposition to maintain defensive control. Unknown situations for the opponent are more likely to lead to defensive errors. Moreover, offensive turnovers have less impact than in possession-focused styles. Misplaced passes in possession are part of the plan and foster the necessary disorganization in the opponent. Consequently, compared to pure transition play, more high-quality scoring chances arise “more easily,” increasing the effectiveness of the individually inferior team.
Certain possession-based principles can be used to change the character of the game and force randomness through frequent uncontrollable situations. Example principles could include: attack vertically/diagonally as early as possible; free space = dribbling space; open dribbling lanes and ensure passing options; maximize dynamism, minimize control; first action after ball recovery should be forward; …
Since this style of play relies on second balls, optimal counter-pressing is essential. Accordingly, optimal positioning in possession is crucial. Players’ positioning is no longer designed for ideal positional play but is oriented toward potential counter-pressing situations. The described access-generating counter-pressing is characterized by a strong focus on progression in possession. Counter-pressing can also be actively provoked or deliberately induced, for example, by playing balls into/behind the defense in the half-space with appropriate positioning of teammates.
A highly dominant but risky approach would be ball-oriented marking during counter-pressing. This ensures maximum pressure and minimal opponent development in possession but can only be applied situationally when teammates are well-positioned near the ball. An interesting complement could be the situational use of an offside trap, which also maximally suppresses the opponent’s possession play. Offensive pressing should similarly aim to regain the ball as often as possible while minimizing blocking, provoking many duels and preventing the opponent from developing their play.
In goal-scoring as well, necessary luck in randomness should be minimized to increase efficiency. The previously defined variables of randomness are useful here:
-
Rebounds: The more players in the penalty area, the higher the probability of a usable rebound. The ratio of teammates to opponents should also be considered. The higher the ratio, the greater the likelihood of a usable rebound.
-
Deflections: The better the position relative to goal, the higher the probability of an uncontrollable deflection.
-
Distance: The better the shot position matches the player’s abilities, the higher the probability of a successful shot.
-
Defensive pressure: The greater the pressure on the opponent, the higher the likelihood of errors. Additionally, the greater the dynamism toward the opponent’s goal, the higher the chance of a usable error or even an own goal.
Overall, this playing style is characterized by a focus on second balls and maximum dynamism. Current teams using similar principles include Iraola’s Bournemouth in possession, Flick’s offside trap at Barcelona, and Bielsa’s pressing teams. Earlier teams that employed interesting aspects of this style include Klopp’s counter-pressing teams and Ajax Amsterdam in the 1970s against the ball.
5. Conclusion
This article aimed to provide an overview of the factors influencing chance conversion. Chance conversion involves far more components than just luck and psychological factors. It can be systematically trained and improved. At the same time, it is likely one of the most decisive factors in football. After all, football ultimately comes down to who scores more goals, making chance conversion naturally extremely important.
Since the quality of scoring chances is one of the most data-driven areas of football research, a wide range of relevant studies can be found. Notably, the studies are also quite recent, reflecting how data-driven analysis has become an integral part of modern football. Consequently, it will be exciting to see how football continues to evolve based on the insights gained from these data.
Note:
For better readability, the studies in this article are linked directly. A traditional reference list has therefore been deliberately omitted.
Author: MH is a football aficionado at heart. His apartment resembles a football library, with shelves filled with books on the great tacticians from Rinus Michels to Pep Guardiola. Of course, the book from Spielverlagerung.de is not missing. For MH, football is not just a game, it’s a way of life. He can be found on X under Mh_sv5 and LinkedIn.
3 Kommentare Alle anzeigen
speed stars September 13, 2025 um 11:58 am
This was a really insightful read! I appreciate how it breaks down the complex topic of chance conversion into manageable sections, explaining the interplay between tactics, player abilities, and the undeniable role of randomness.speed stars unlock
AG September 9, 2025 um 6:48 pm
Be careful with these studies: they look at the outcome afterwards, and mix in goals by using goals/shot. If you look instead at the xG studies, chance conversion as discussed is hardly correlating from season to season.
Next Generation September 11, 2025 um 2:02 pm
I would divide your comment into two sections:
1. Possible outcome bias in the correlation between chance conversion and success
2. Correlation between chance conversion as measured by xG and success
1. I understand what you mean: there is a risk of outcome bias, since successful teams score more goals and at the same time goals are included in the metric used for evaluation (shots/goal).
The problem with efficiency, however, is that it can hardly be measured without goals themselves. Therefore, “goals” can hardly be excluded from the correlation between success and efficiency that is to be examined.
It must also be taken into account that a successful team, which by definition scores more goals, does not necessarily have more goals per shot. A successful team could just as well be inefficient and still score many goals. In this respect, the correlation found in the studies between success and efficiency is not really affected by outcome bias.
2. I will now address alternative metrics that could possibly measure the correlation between efficiency and success better, because they are based on xG.
xG/shot could be an option. However, this does not directly measure efficiency, but rather effectiveness. After all, it measures the average quality of scoring chances.
Goals/xG or xG/goal is probably the more obvious variant for measuring the correlation between chance conversion (i.e. efficiency) and success. The question here is therefore whether this metric also shows a correlation with success.
At the team level, it is evident in xG models that many of them are subject to a bias that underrates stronger teams and overrates weaker teams. This leads to the fact that stronger teams indeed tend to outperform their xG values. More on this in section 3.1.1. of the article “Improving Efficiency – is it possible?”.
At team level it must also always be taken into account that a team can change significantly. Metrics that should be taken over as large a period of time as possible in order to generate a large data basis become less accurate due to the changes within a team. This is possibly also the reason why some studies find no connection between efficiency as measured by xG and success – despite the findings mentioned above.
Accordingly, it also makes sense to move to the player level. Here, the application of xG/goal as a measure of a player’s efficiency is quite common. However, there is also a better metric, which instead compares pre-shot with post-shot xG values. Here, for the first time, we would also have removed the goals dependent on chance from the metric.
This metric also shows that there are players who are able to significantly outperform their pre-shot xG values with their post-shot xG values over many years. More on this as well in section 3.1.1. …
Why are these often not the “most successful goalscorers,” the strikers? This is because top strikers, due to their position, get into better finishing positions. It is therefore only logical that these players usually do not outperform their xG values.
However, this fact does not lead to the conclusion that efficiency as measured by xG is not correlated with success. On the contrary, as mentioned, some top players are characterized by being more efficient than others, and thus more successful.
I hope this adequately addresses your commentary. Many thanks again for your valuable input and best regards.